Insights with D3
Below shows a few unique graphs created using the D3 JS library. These graphs created great insight regarding our users.
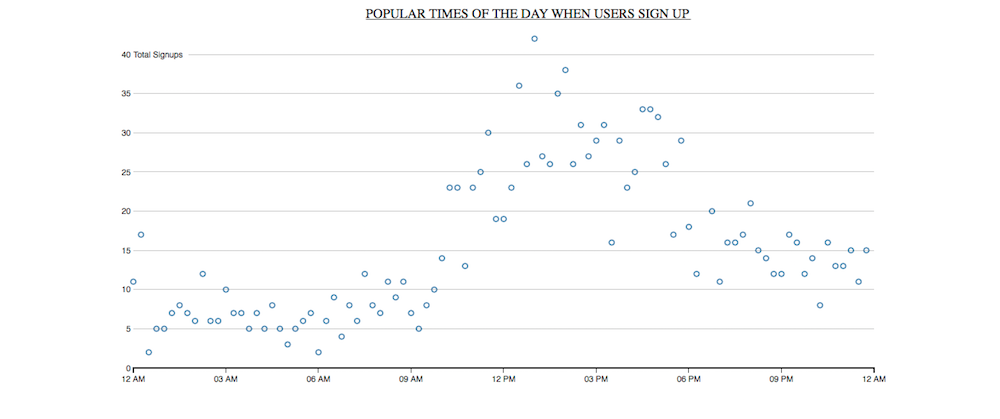
Here we have total signed up users. I've aggregated the times they've signed up to a 24 hour window.
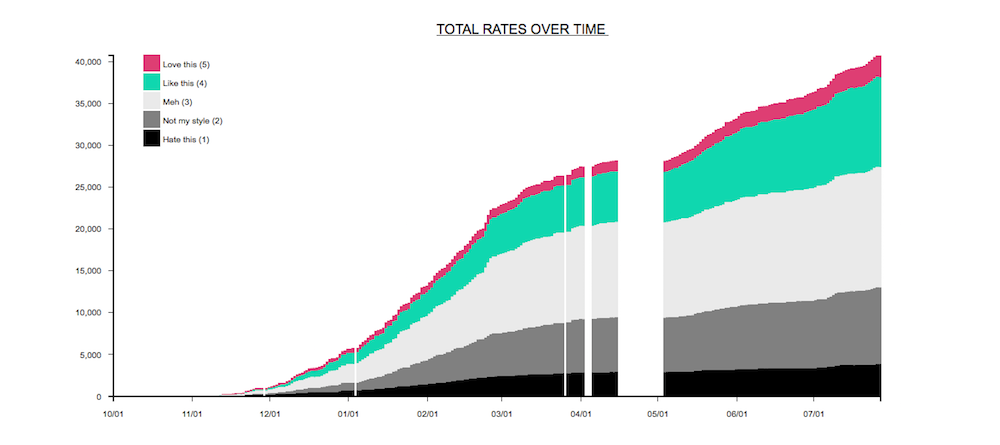
Users were able to rate images on a scale from 1 to 5. I've stacked all 5 levels and added a legend table to tell the difference.